Social mobility by area
We have updated our 4 composite measures of social mobility by local authority. We have also:
- added analysis by ‘travel-to-work area’ to better understand local labour market opportunities for young people, and innovation and growth
- combined UK Census data for 2001 to 2021 (2022 for Scotland) to examine changes in the occupational makeup of local authorities over time – this has allowed us to look at individual areas in Northern Ireland for the first time
Highlighted content
Composite indices by local authority
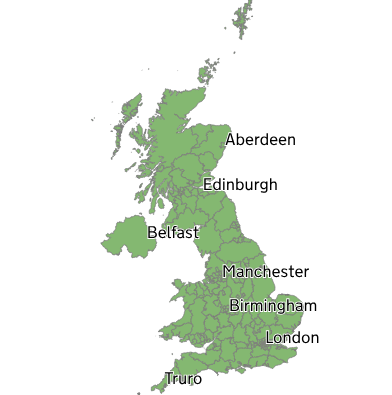
For each composite measure, 205 regions in the UK are put into 7 groups based on their composite scores.
Read more about our social mobility by local authority analysis.Travel-to-work areas

228 travel-to-work areas (a geographical zone where a majority of people both live and work) in the UK are put into 7 groups based on their composite scores of:
Occupational class structure by local authority
See how the occupational class structure of local areas in the UK have changed between the 2001 and 2021 Censuses.
Read more about our occupational analysisElsewhere in State of the Nation 2026
Mobility outcomes look at people's occupations, educational levels and housing situations, typically in their 40s and 50s.
Intermediate outcomes focus on the experiences of young people as they move through education and into work.
Drivers of social mobility are the background conditions that make social mobility easier.